Muhamad
Juwandi.
4th Semester Data Science student at Universitas Terbuka, passionate about transforming raw data into elegant digital solutions.

Muhamad Juwandi
Data Scientist · Developer
What I bring to the table
Technical Arsenal
A lifelong learner focusing on Data Science and Web Development, steadily building expertise to craft impactful digital solutions.
Data Science & Analysis
Web Dev
Communication
Supplemental Design
Experience
Web Developer & Technical Operations
Naeta Digital Consultant
● Full-Stack Management: Overseeing the end-to-end development and maintenance of 3 corporate websites, ensuring 99.9% uptime and optimal performance.
● Web Architecture: Designing and implementing website structures to improve user experience (UX) and increase online engagement through technical SEO and responsive design.
● Content & System Integration: Developing SEO-friendly technical content and managing CMS configurations to align with brand identity and marketing strategies.
● Agile Development: Demonstrating the ability to manage professional client projects while simultaneously developing independent data science and AI applications.
Portfolio
Curated work across various disciplines.
An end-to-end AI-driven predictive pipeline and interactive web dashboard designed to forecast hourly electricity demand for the Tokyo Electric Power Company (TEPCO). By integrating multi-year time-series data, weather APIs, and Deep Learning models (PyTorch LSTM), the system provides high-accuracy forecasts (MAE ~150 MW) and real-time peak-shaving simulations, empowering energy stakeholders to proactively mitigate outage risks and significantly reduce emergency power procurement costs.
1. Context & Business Challenges
- Grid Stability & Load Balancing: Managing large-scale energy demands requires precise hourly load balancing in the Kanto region to ensure grid stability.
- Weather-Driven Demand Spikes: Extreme weather anomalies (temperatures >28°C) create high uncertainty in electricity demand surges.
- Operational & Financial Risks: Inaccurate forecasting leads to a high risk of power outages and massive budget overruns caused by sudden, expensive emergency power purchases on the spot market.
2. Technical Solution & Role (Data Scientist / Full-Stack Developer / UI/UX Designer) Designed and engineered a scalable, end-to-end predictive infrastructure and an interactive web application:
- Automated ETL Pipeline: Built robust ETL scripts to clean and process massive multi-year time-series datasets, handle Japanese data encoding parsing, and integrate secondary weather attributes via external APIs.
- Hybrid AI Modeling (PyTorch & Prophet): Developed a predictive architecture comparing the reliability of Probabilistic Additive Models (Facebook Prophet) against Deep Learning Neural Networks (PyTorch LSTM) to effectively capture anomaly trends during extreme weather.
- Interactive Web Dashboard (Streamlit, Pandas, Matplotlib): Transformed complex analytical logic into a seamless, high-performance UI/UX. The dashboard features a memory-efficient, real-time “Peak Shaving Simulator” equipped with visually actionable elements like interactive temperature heatmaps and demand duration curves.
3. Business Impact & Insights
- High-Precision Forecasting: The implemented PyTorch LSTM model achieved highly accurate and consistent predictions, successfully narrowing the error margin to a Mean Absolute Error (MAE) of ~150 MW.
- Cost Reduction & Efficiency: Delivered a critical decision matrix to corporate management, enabling them to simulate peak-shaving strategies and avoid millions of Megawatts of inefficient, high-cost power procurement.
- Proactive Risk Mitigation: Successfully translated complex mathematical data into precise visual insights, empowering executives to proactively identify grid stress and mitigate potential outages before they occur.

TEPCO Electricity Demand Forecasting & Peak Shaving Simulator
An end-to-end AI-driven predictive pipeline and interactive web dashboard designed to forecast hourly electricity demand for the Tokyo Electric Power Company (TEPCO). By integrating multi-year…
An end-to-end data science and analytics project designed to transition Olist e-commerce from assumption-based to data-driven decision-making. By integrating complex relational databases, applying K-Means Clustering for RFM segmentation, and utilizing Facebook Prophet for time-series forecasting, the project delivered a centralized interactive dashboard that optimizes targeted marketing, proactive inventory planning, and logistics evaluation.
1. Context & Business Challenges
- Lack of Data Visibility: The company needed a centralized data overview to shift towards a data-driven strategy.
- Customer Behavior Mapping: Faced difficulties in mapping the behavior of millions of users to create personalized marketing campaigns.
- Demand Uncertainty: The inability to accurately predict market demand fluctuations led to high risks of overstocking or stockouts.
- Logistics & Customer Satisfaction: Needed to identify the root causes of high volumes of poor customer reviews and connect them with logistical performance metrics.
2. Technical Solution & Role (Lead Data Scientist) Led the entire single data processing lifecycle (End-to-End Data Science), culminating in a unified interactive analytical dashboard:
- Data Engineering & Integration: Executed data cleaning and complex feature engineering by integrating 9 high-value relational tables.
- Customer Segmentation (K-Means Clustering): Applied logical mathematical approaches to execute an RFM (Recency, Frequency, Monetary) customer segmentation model.
- Time-Series Forecasting (Facebook Prophet): Designed and trained an advanced analytical model to handle fluctuating demand and heavy seasonality (e.g., Black Friday effects), optimized further by incorporating Brazilian holiday data.
3. Business Impact & Insights
- Cost Savings & Optimal Retention: Successfully divided customers into 4 essential segments (such as “Champions” and “Hibernating”). This allowed the marketing team to deploy highly targeted, cost-efficient win-back campaigns instead of distributing random, budget-draining promotions.
- Financial & Inventory Planning: The high-accuracy forecasting revealed a stable upward trend in the “Health & Beauty” category. This provided robust analytical justification for inventory management to increase buffer stock by 10-15%, ensuring the company captured the next quarter’s profit momentum.
- Logistics Mitigation: Statistically and causally validated the negative correlation between regional delivery inefficiencies and dropping review scores. This provided executive directors with concrete, unarguable evidence needed to review and overhaul their logistics Service Level Agreements (SLAs) and SOPs.
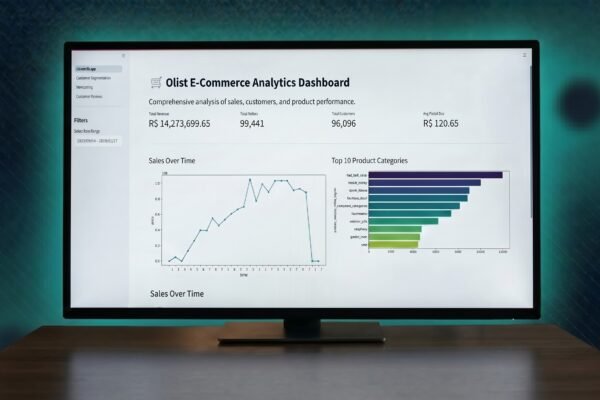
Olist E-commerce End-to-End Sales & Customer Analytics
An end-to-end data science and analytics project designed to transition Olist e-commerce from assumption-based to data-driven decision-making. By integrating complex relational databases, applying K-Means Clustering…

Equilibrium-X is an AI-driven pricing agent utilizing Causal Inference and Game Theory to navigate market volatility and logistics disruptions. It provides executives with a compliance-safe, real-time interactive dashboard to optimize pricing strategies, successfully projecting up to a 43% increase in net margin while mitigating the risks of price wars and algorithmic collusion.
1. Context & Business Challenges
- Market Volatility: Facing operational cost crises due to logistics disruptions (“The 2024 Problem”).
- Traditional ML Limitations: Existing algorithms only read historical data correlations and fail to distinguish cause-and-effect. They cannot reliably answer strategic questions regarding the risk of price wars if the company raises selling prices.
- Regulatory Constraints: Management requires a robust automated system that strictly complies with anti-monopoly regulations and the ban on Algorithmic Cartels (Tacit Collusion – AB 325 Regulation).
2. Technical Solution & Role (Lead Data Scientist / AI Developer) Designed the end-to-end architecture of the decision engine and War Room Dashboard using an advanced scientific approach:
- Causal AI Engine (Python, Microsoft DoWhy): Built causal inference algorithms to discover true price elasticity by isolating confounding variables (e.g., holiday seasons vs. price promotions). The engine’s reliability is validated using Placebo/Dummy Tests to ensure zero statistical hallucinations.
- Game Theory Algorithm (Python, Nashpy): Applied competitive market matrix calculations to find the optimal and secure pricing point (Nash Equilibrium) for the company, even when facing aggressive pricing from competitors.
- Strategic Dashboard & Governance (Streamlit, Pandas, Plotly): Designed an interactive UI/UX that projects margin vs. volume scenarios to executive levels. The system is equipped with real-time legal detection (“Algorithmic Police”) that alerts against mark-up tactics exceeding fair competition limits (mark-ups > 20% without validated reasons).
3. Business Impact & Insights
- Data-Driven Insights: The Strategic Simulation module revealed counter-intuitive findings: during a logistics crisis surge, holding prices to maintain market share will actually destroy profit.
- Corporate Impact: The system drove a crucial shift in business strategy, recommending a “Premium” pricing approach to facilitate volume shedding. Using the Nash Equilibrium recommendations, the company projected a Net Margin increase of up to 43%, despite a temporary drop in total volume.
- Legal Compliance: The Governance module successfully aligned financial decisions to be 100% safe and compliant with state anti-collusion regulations, protecting the corporation from legal risks and fines.

Equilibrium-X (Autonomous Strategic Pricing Agent)
Equilibrium-X is an AI-driven pricing agent utilizing Causal Inference and Game Theory to navigate market volatility and logistics disruptions. It provides executives with a compliance-safe,…
Language Proficiency
Japanese Language Learning Journey (JLPT)
JLPT N5
Passed
January 2026
JLPT N4
In Progress
July 2026
JLPT N3
Target
December 2026
JLPT N2
Target
July 2027
Gallery
A visual log of moments and milestones.


Latest Insights

Beyond Standard Prompts: Why Agent Skills Are the Next Logical Step in Data Science
I’ve been running the same analytical tasks on loop lately. Between my 4th-semester Data Science coursework and deploying...

Ditching Vector DBs: Why I am Exploring memweave for Local AI Agent Memory
Whenever I prototype local AI tools alongside my standard freelance web deployments, managing memory becomes a bottleneck. Models...

The “Superagency” Shift: Why AI Adoption is Stalling at the Top
McKinsey recently released a report on “Superagency in the Workplace,” arguing that combining human effort with AI creates...